
As LLMs like Google’s Gemini AI and Apple Intelligence become integrated into mainstream mobile apps, developers need more than good prompts — they need tools to debug how AI behaves in production.
This guide covers the best tools and techniques to debug, monitor, and optimize AI workflows inside Android and iOS apps. It includes how to trace prompt failures, monitor token usage, visualize memory, and use SDK-level diagnostics in Android Studio and Xcode.
📌 Why AI Debugging Is Different
- LLM output is non-deterministic — you must debug for behavior, not just bugs
- Latency varies with prompt size and model path (local vs cloud)
- Prompts can fail silently unless you add structured logging
Traditional debuggers don’t cut it for AI apps. You need prompt-aware debugging tools.
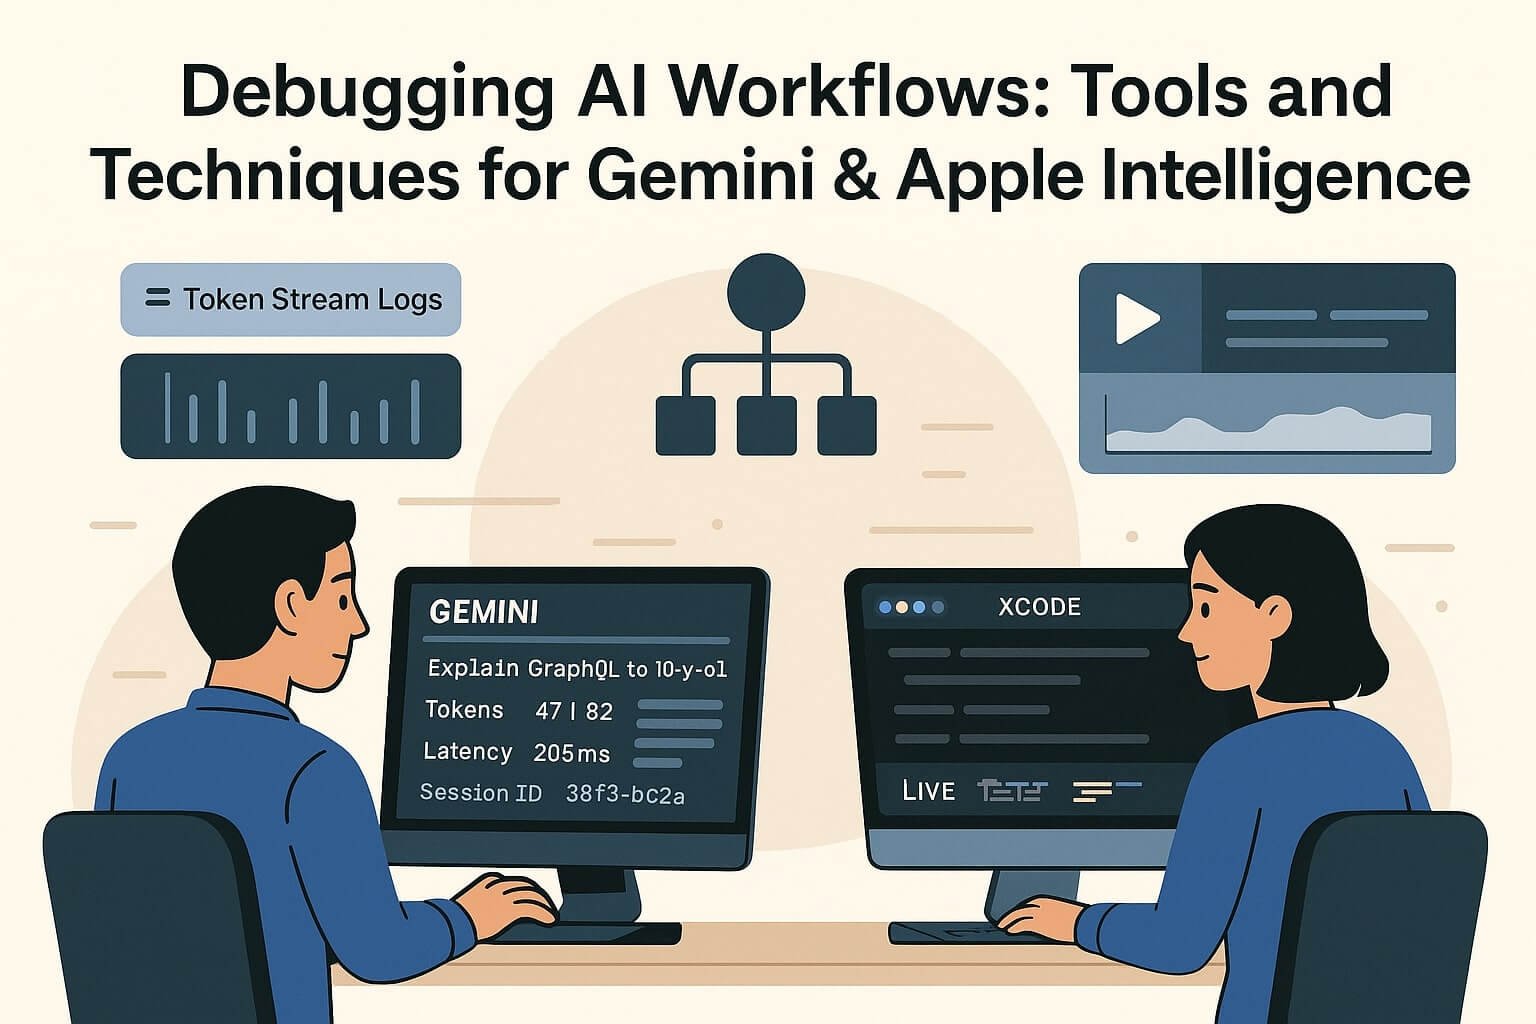
🛠 Debugging Gemini AI (Android)
1. Gemini Debug Console (Android Studio Vulcan)
- Tracks token usage for each prompt
- Shows latency across LLM stages: input parse → generation → render
- Logs assistant replies and scoring metadata
// Gemini Debug Log
Prompt: "Explain GraphQL to a 10-year-old"
Tokens: 47 input / 82 output
Latency: 205ms (on-device)
Session ID: 38f3-bc2a
2. PromptSession Logs
val session = PromptSession.create(context)
session.enableLogging(true)
Enables JSON export of prompts and responses for unit testing and monitoring.
3. Prompt Failure Types
- Empty response: Token budget exceeded or vague prompt
- Unstructured output: Format not enforced (missing JSON key)
- Invalid fallback: Local model refused → cloud call blocked
🧪 Testing with Gemini
- Use Promptfoo or Langfuse to run prompt tests
- Generate snapshots for expected output
- Set up replays in Gemini SDK for load testing
Sample Replay in Kotlin
val testPrompt = GeminiPrompt("Suggest 3 snacks for a road trip")
val result = promptTester.run(testPrompt).assertJsonContains("snacks")
🍎 Debugging Apple Intelligence (iOS/macOS)
1. Xcode AI Debug Panel
- See input tokenization
- Log latency and output modifiers
- Monitor fallback to Private Cloud Compute
2. AIEditTask Testing
let task = AIEditTask(.summarize, input: text)
task.enableDebugLog()
let result = await AppleIntelligence.perform(task)
Outputs include token breakdown, latency, and Apple-provided scoring of response quality.
3. LiveContext Snapshot Viewer
- Logs app state, selected input, clipboard text
- Shows how Apple Intelligence builds context window
- Validates whether your app is sending relevant context
✅ Common Debug Patterns
Problem: Model Hallucination
- Fix: Use role instructions like “respond only with facts”
- Validate: Add sample inputs with known outputs and assert equality
Problem: Prompt Fallback Triggered
- Fix: Reduce token count or simplify nested instructions
- Validate: Log sessionMode (cloud vs local) and retry
Problem: UI Delay or Flicker
- Fix: Use background thread for prompt fetch
- Validate: Profile using Instruments or Android Traceview
🧩 Tools to Add to Your Workflow
- Gemini Prompt Analyzer (CLI) – Token breakdown + cost estimator
- AIProfiler (Xcode) – Swift task and latency profiler
- Langfuse / PromptLayer – Prompt history + scoring for production AI
- Promptfoo – CLI and CI test runner for prompt regression
🔐 Privacy, Logging & User Transparency
- Always log AI-generated responses with audit trail
- Indicate fallback to cloud processing visually (badge, color)
- Offer “Why did you suggest this?” links for AI-generated suggestions
🔬 Monitoring AI in Production
- Use Firebase or BigQuery for structured AI logs
- Track top 20 prompts, token overage, retries
- Log user editing of AI replies (feedback loop)